Every year, farmers must decide what to plant. There are many factors that are considered when making this decision. This season, for the 2020 crop year, these decisions are compounded by a dramatic decline in market prices and, because of these low prices, net returns are expected to be slim. The probability of even negative returns is increased.
Prices have declined in large part due to demand and market uncertainties caused by the COVID-19 virus pandemic. Thus far this year, corn has declined almost 18%, cotton about 21%, and soybeans almost 14%.
USDA (Prospective Plantings, March 31, 2020) estimates that US corn acreage planted this year will increase 5% and soybeans 9.2%. Cotton is expected to decline 1% and peanuts increase 7%. Focusing on the Southeast (AL, FL, GA, NC, SC, and VA), overall corn and peanuts are expected to be up and cotton and soybeans down. Prices have declined further since the USDA end of March report, however, and this may alter these earlier farmer intentions. Comparing Net Returns
Farmers make planting decisions based on many factors. Chief among these are how do net returns compare from one crop to the next. The comparison depends on what yield do you expect, what price do you expect, and what are the variable costs. Variable costs can also be called “operating costs”. These are costs that are incurred only because you make the decision to produce and only because you will produce one crop versus another. When comparing net returns, it isn’t necessary to include costs that would not change and would be incurred anyway regardless of the planting decision. Variable costs include inputs like seed, fertilizers, chemicals, fuel and repairs, crop specific hired labor, custom hire, crop insurance, irrigation, marketing and fees, drying and storage, etc.
Below are estimates of irrigated and non-irrigated net returns for 2020. Expected yield and expected variable costs are estimates from University of Georgia Extension. Cost estimates are available from Extension in each state. Such estimates are only guidelines and should be modified to reflect your farm business as accurately as possible. Every farm is different and even on a farm from field to field.
Special Note- Prices: The price used is the price on the harvest time futures month as of April 20 plus expected basis (+ or -). The peanut price is the expected season average price. The price of cotton includes any LDP or MLG and fiber quality adjustments. The cotton marketing loan program and AWP and LDP/MLG mechanisms provide a “floor” or worst case scenario to the farmer of roughly 59 cents and buffer the farmer from the price going lower. This is a consideration worth noting. For cotton, 59 cents should be regarded as the minimum regardless of what happens. In these comparisons, a 59 cents minimum futures price plus 3 cents basis and quality differences equals 62 cents.
The purpose is to do a relative comparison ranking of net returns—not focused necessarily on the absolute dollar amounts—just how crops compare/rank. For each crop, yields may average higher or lower than expected, the futures price may average higher or lower, basis may be stronger or weaker, and costs may also change.
Assuming the costs, yields, and prices shown, peanuts rank comparatively highest in both non-irrigated and irrigated production. Soybeans rank second after peanuts. Cotton ranks third, ahead of only corn in irrigated production and ranks last in non-irrigated.
The variable costs shown do not include land rent. Cash rent may be included, however, or yield and costs adjusted to reflect the producer share only in a share rent. If cash land rent were included, the net return would likely be negative in non-irrigated production in all crops except peanuts. For irrigated production, net return is likely still positive after rent but the margin is slim. In 2020, farming on rented land will be an especially risky cash flow proposition. In terms of managing cash flow obligations, higher returning crops might be preferred on rented land.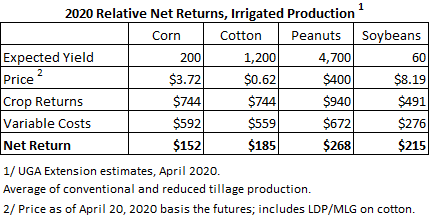
Playing What If
These comparative net returns are based on current price levels and expected yield. Neither price nor yield is guaranteed at this juncture. That is why the emphasis must be on ranking not absolute dollars. It is also very important worth considering that not only futures price, but basis also is highly variable and uncertain in this market environment. Farmers may plant or not plant a crop because it has a strong or weak basis. For 2020, farmers should consider carefully what basis is expected.
Farmers should adjust these costs to fit their operation and this is highly encouraged. But based on these costs and assuming these expected prices and yield, several “what if” scenarios can be very useful in helping to look at how crop alternatives compare. This can be useful in the decision on what to plant.
___________________________________________________________________________________________
The net return from cotton is expected to be less than peanuts. What does the price of cotton need to be to provide the same net return as peanuts?
For non-irrigated– $98 – $5 = $93 more needed
$93 difference / 750 lbs yield for cotton = $0.124 additional price
$0.62 assumed cotton price + $0.124 more = $0.742
Repeat this process for irrigated.
____________________________________________________________________________________________
What does cotton yield need to be provide the same net return as peanuts?
For irrigated– $268 – $185 = $83 per acre more for peanuts
$83 difference / $0.62 price for cotton = 134 more lbs needed
1,200 assumed cotton yield + 134 lbs more = 1,334 lbs
Repeat this process for non-irrigated
____________________________________________________________________________________________
What does corn price need to be to provide the same net return as cotton and peanuts
For irrigated– $185 – $152 = $33 per acre more for cotton
$33 difference / 200 bushel yield for corn = $0.165 per bushel more
$3.72 assumed corn price + $0.165 more = $3.89
Repeat this process for peanuts and non-irrigated
____________________________________________________________________________________________
For many farms, the decision especially between cotton and peanuts and corn can be an important one. The deciding factor in many situations is—given the prices and costs, agronomically which crop has the yield advantage or which crop is likely to make the best yield under the circumstances? Again, the farmer should develop his/her own cost estimates and expected prices are uncertain but assuming costs and prices, it is the very helpful to think about the planting decision from an environment very familiar to the farmer—yield and which crop from a yield perspective is most likely to be more profitable.
Farmers actually do this although they may not take this same approach. But through their experience and knowledge of their farms, they know what crop has the yield potential and more or less yield risk. Below is a comparison of corn and cotton and peanuts and cotton.


As already discussed, positive net returns are currently expected to be slim for 2020 based on where markets are at present. For some farmers, the decision of “what do I plant” may come down to which crop they feel has the best yield potential and less yield risk. Farmers have little to no control over any factors in the net return equation—but which crop might be the less risky at least from a yield perspective?
Comparing corn and cotton, for non-irrigated production for example, if you expect 800 lb cotton, 90 to 95 bushels on corn would be the equivalent. Which crop do feel more likely to make the yield? For irrigated, suppose you expect 1,200 lbs cotton. The equivalent corn yield would be about 210 bushels. Again, which yield do you feel the most comfortable with?
Comparing peanuts and cotton, suppose you expect 800 lb non-irrigated cotton. The equivalent peanut yield would be about 3,100 lbs. For irrigated, suppose you expect 1,100 lbs cotton. The equivalent peanut yield would be 4,000 lbs.
Risk Management
Planting decisions will also be made on the basis of which crop has the better opportunity to navigate the unknown. The earlier tables and net returns are based on current markets. This will change by harvest time and afterwards. Which crop(s) have the better chance of price improvement? Likewise, which crop(s) have the higher chance of prices going lower? A crop that isn’t ranked the highest now could end up the better choice if its price improves compared to the alternatives. A crop that is ranked high now, likewise, could end up looking like not such a good choice if price declines. Also, how do crops compare in terms of marketing—availability of contracts, marketing/pricing alternatives, etc? As already mentioned, the Marketing Loan LDP/MLG for cotton is a price stabilizing factor.
Crop insurance is also a factor to consider in planting decisions. What policy options and coverages are available? Does farm history and experience offer any advantage or disadvantage for a particular crop? How much coverage/protection do you desire and what policy choices do you have?
The crops shown here each have both Yield Protection and Revenue Protection available. One factor to consider is the policy Projected Price. The Projected Price is the rate paid for any insured loss on a Yield policy. A Revenue policy guarantee is based on the higher of the Projected Price or Harvest Price. The Harvest Price is not yet known and will not be determined until this Fall during its appropriate price discovery period. But the above table shows where the harvest time futures price is currently. Compared to where the harvest time futures contract price is currently, the Projected Price is highest for cotton.
In addition to yield or revenue protection (companion policy) that covers your crop on your farm, additional/supplemental protection is also available in the form of SCO or STAX. SCO and STAX are area policies. SCO is available for the four crops we have been discussing. STAX is cotton only. If a farm has crop base and if that base is enrolled in ARC, acres planted to that crop are not eligible for SCO. The farm may, however, enroll base in PLC and have SCO on acres planted. If cotton base is enrolled in ARC or PLC, either program, cotton acres planted on that farm are not eligible for STAX. But, the farm base can go to PLC and acres planted also insured with SCO.
Some producers purchase minimal coverage, some moderate coverage, some purchase “all the coverage I can get”. The sales closing deadlines have already passed for the 2020 crop season and the deadline for enrollment in ARC/PLC for 2020 is June 30.
The availability of the new HIP-WI (Hurricane Insurance Protection-Wind Index) policy may have an impact on planting decisions. This new program offers protection in addition to the farms companion policy and any STAX or SCO policy. The sales closing deadline for 2020 is April 30 but will be the same as for all other polices beginning next year. HIP-WI could be especially beneficial and a deciding factor in cotton.
Other Factors to Consider
Considerable space has been devoted here to net returns and the factors that impact net returns. The fact is, however, that price and net return are but only one consideration and, for some farmers may not even be the most important.
- Price outlook—Current prices allow a ranking and relative comparison. Consideration must also be given to the outlook for the commodity and how price might change during the remaining growing and market season.
- Government payments—In general, government payments are not a consideration. ARC/PLC payments are made on 85% of base acres, not acres planted. MFP trade assistance payments may or may not be made for 2020—that determination has not been made. Even so, the most recent round of MFP were a flat per acre rate based on historical acreages for the county. CFAP coronavirus relief payments, however, are expected to be made based on 2019 crop price and marketings. So, there is link to production. But, any such payments for 2020 are unknown and yet to be determined.
- Your “baseline”—Expected net returns are only a “baseline”. They are what’s expected based on many assumptions and estimates. Planting decisions must also take into account the uncertainty/risk in net returns and how crops compare.
- Rotations and conservation—Most farmers will use market signals and expected net returns to only tweak the operation. They may switch a few or modest amount of acres here or there but will try to stick with established crop rotations and cover crops as much as possible. In other words, if net returns are expected to be low, you just take your punches and hope to survive another year.
- Some crops just have their place—There are situations from farm to farm, field to field where due to soil type, fertility, weed management needs, etc. that a particular crop is just a better fit. Also, let’s suppose your yield goal is 1,200 lbs cotton and 5,000 lbs peanuts and 225 bushel corn. You may feel in a particular situation that one crop offers a much better opportunity to get there.
- Credit—The availability of money can be a constraint. If funds are limited, you may have to plant the cheapest crop although that crop may not be the most preferred based on net returns.
- Machinery, equipment, and labor—Planting decisions are constrained by limits on machinery, equipment, and labor. You can’t plant more than you can manage efficiently and timely for the remainder of the season. Some farmers rely on custom harvest for some crops. When prices are low and margins thin, there may not be room in the budget for custom harvesting.
- Potential for cost management—Consideration should be given to which crop’s costs can be managed the best. Net returns consider what is expected. Are there advantages or disadvantages from crop to crop as to costs getting out of hand? Also, if there is delayed planting or poor stands or replanting or poor performance or drought or flood or other problems, are there manufacturer or supplier programs that will cover the loss or provide assistance?
Note: Sponsorship and funding support provided by Bayer CropScience. This material is not affiliated with the University of Georgia. All opinions and any errors in information and analysis are solely those of the author. This publication is not affiliated with the University of Georgia. The author can be reached by email at donshur@uga.edu or dshurley@abac.edu, by phone at (229) 386-3512 or 386-7275 or on Facebook at https://www.facebook.com/don.shurley.5.